Generative AI-Powered
Institutional Equity Research
Convert Earnings Press Releases and Filings To Models
Perspectec enables buy-side and sell-side institutions to leverage their human capital using generative AI.
Built by a seasoned equity research professional, Perspectec combines deep experience in equities with years of leveraging generative AI to create insights that drive investment decisions.
Christine, Equity Research Associate (AI Agent)
AI Agents Workspace
Select a ticker and launch any of our specialized AI equity research agents
Equity Research AI Agents
Enter a ticker symbol to access AI-powered analysis tools
Important: AI-generated analysis is for informational purposes only and does not constitute investment advice. This represents our views, not personalized recommendations.

Per SEC/Investment Advisers Act: Past performance does not guarantee future results. All investments involve risk of loss.

Per NI 31-103: Not a substitute for advice from a registered portfolio manager. Consult a qualified professional.

Per FCA/COBS 9: Not for UK retail clients. Capital at risk. Not a personal recommendation.
AI content may contain errors. Always verify with official sources.
Key Platform Capabilities
Leveraging AI Models for Reasoning, Visual Reasoning and Agentic Use in Equity Research
Managing Director AI Agent
Have your Capital Markets Managing Director AI Agent automatically interact and invoke pre-configured capital market specialists to complete reports and presentations
Earnings Release to Financial Model
Extract earnings releases, S-1, 10-K, 10-Q and other documents to excel and then to a Financial Model.
Optimize Your Research Process
Generate a list of pre-determined tasks, auto-highlighting the largest deviations and generate a report / pitch highlighting these factors on future financials and valuation.
Equity Research Associate and Assistant AI Agents at your service
Call on our AI agents to perform ad-hoc tasks from generating comps tables, generating presentations, call lists, drafting emails, and tasks not even thought of before.
Incorporate Advanced Forecasting Methods in an Intuitive Way
Enhance forecast accuracy using seasonality, business drivers, and mathematical methods not taught in the CFA program or business schools.
Automated Reports
Generate an initiation, quarterly report or an ad-hoc report based on news articles, earnings releases, filings or 3rd party reports, drawing from your company models.
Institutional Equity Research
These reports are protected under copyright laws and should not be scraped and/or used without the express written consent of Robin Manson-Hing
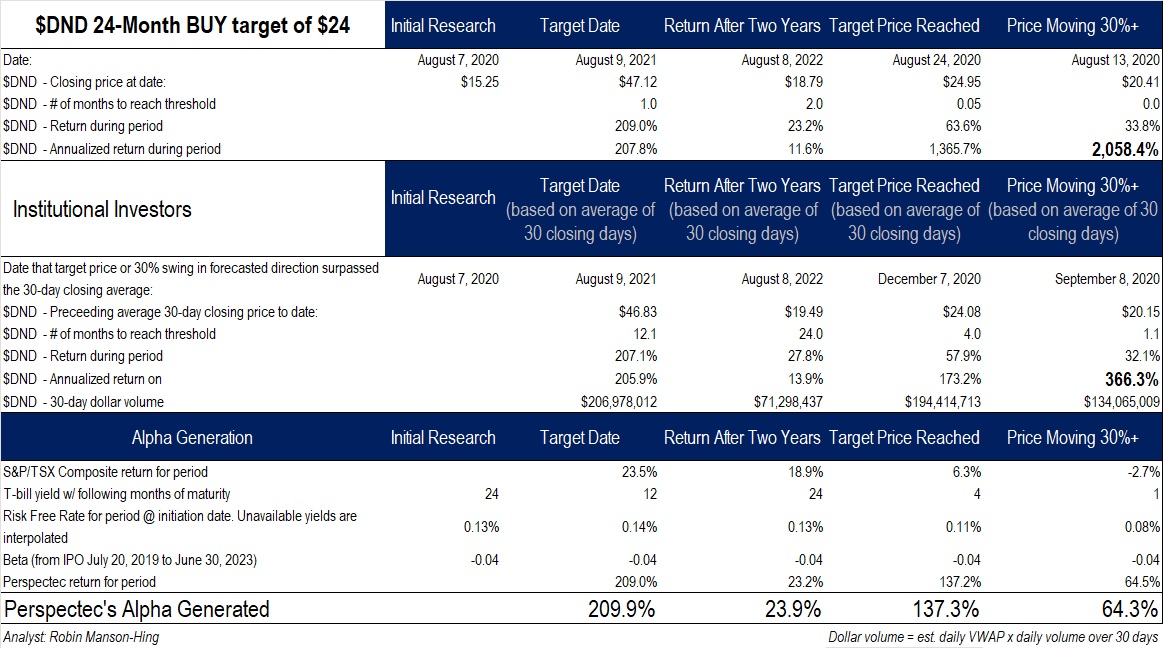
Dye & Durham (DND.TO)
Legal technology SaaS provider with mission-critical workflow solutions. August 8, 2020 coverage showcasing our detailed analysis of growth opportunities and market position.
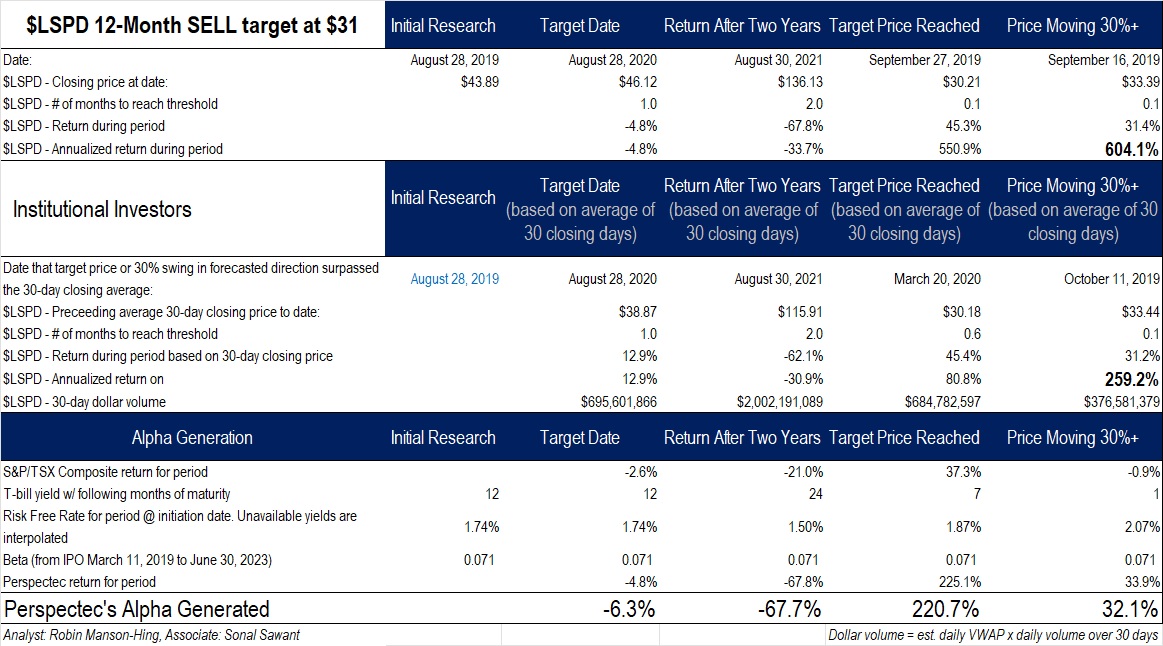
Lightspeed POS (LSPD.TO)
Comprehensive analysis of Lightspeed's cloud-based commerce platform and growth trajectory in the SMB market. Report from August 28, 2019.
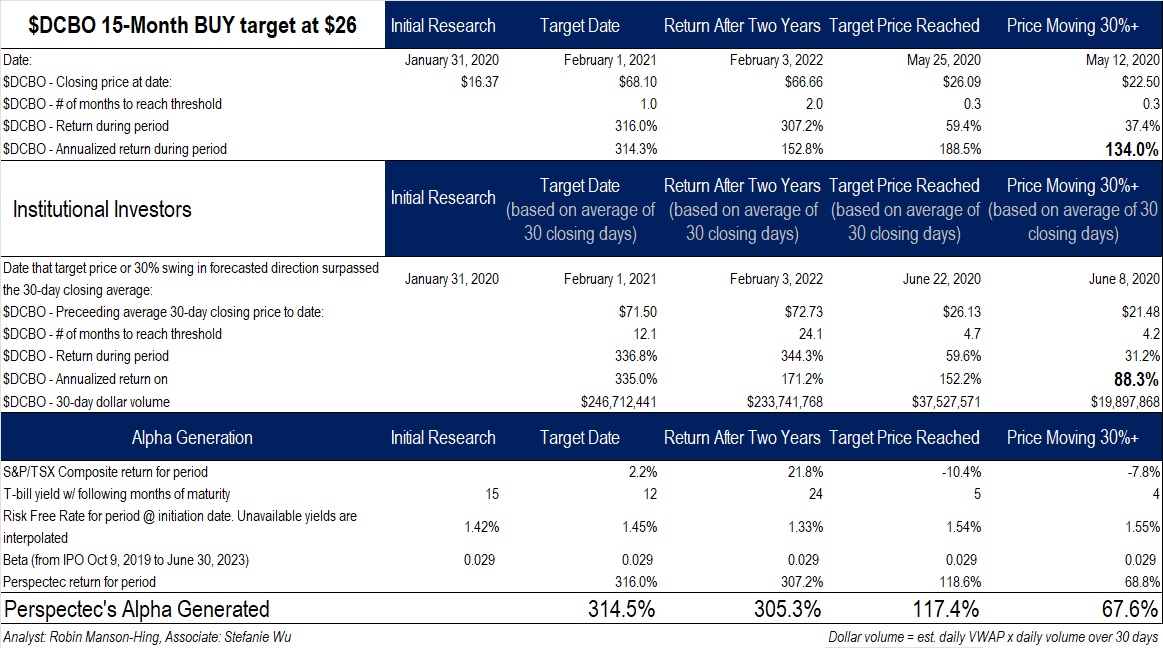
Docebo (DCBO.TO)
Executive summary on Docebo's AI-powered learning platform and its competitive positioning in the e-learning market. Published November 29, 2019.
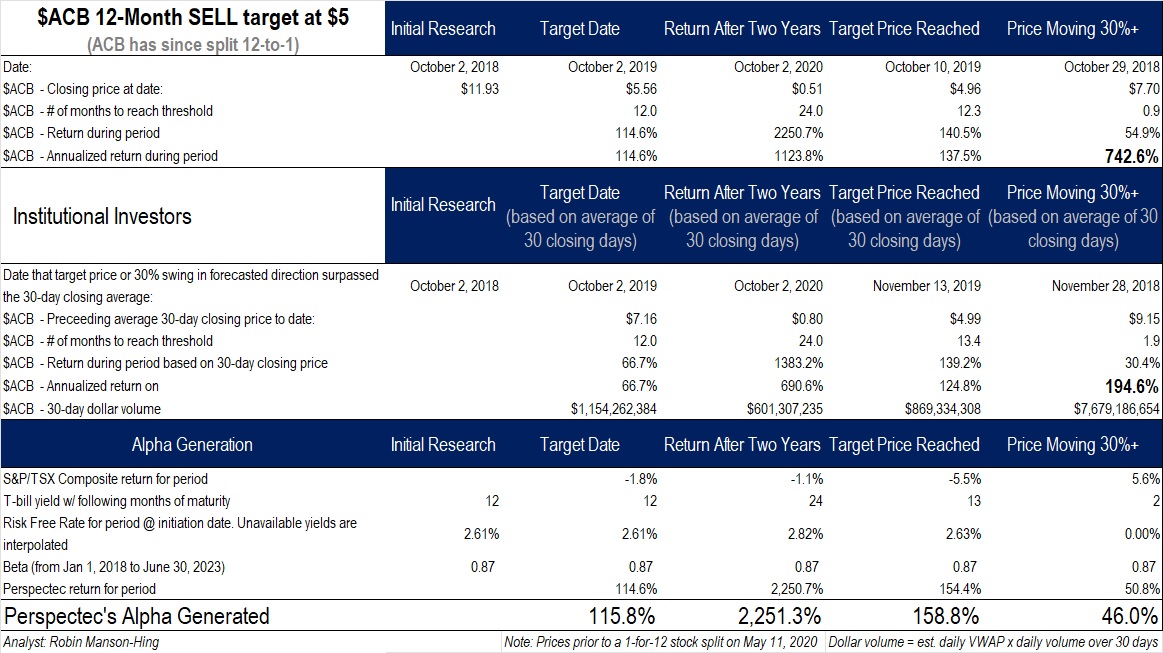
Aurora Cannabis (ACB.TO)
In-depth analysis of Aurora's strategic position in the rapidly evolving cannabis industry. Research published October 8, 2018.
Aphria Inc. (APHA.TO)
Detailed equity analysis of Aphria's business model, market position, and growth prospects in the cannabis sector. Published April 30, 2020.

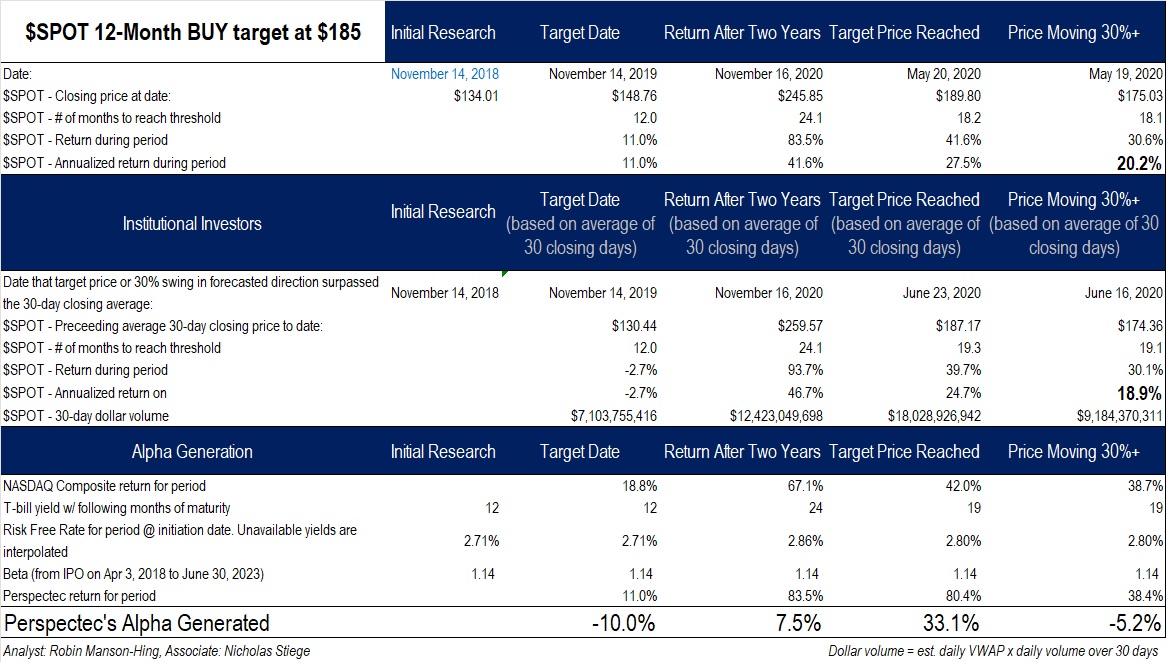
Spotify Technology (SPOT)
In-depth research on Spotify's streaming business model, competitive landscape, and growth potential in the global audio streaming market. Published November 14, 2018.
Experience
Equity Research Associate Program
Developing the next generation of equity research talent
“Perspectec's 1-on-1 training program equips you with the skill set to stand out from the crowd and publish differentiated, value-add research. The founder, Robin, provides tireless support, guidance and helps mold you for the industry. Very rarely do you get the opportunity to work closely with a professional with a strong knowledge base of the technology sector and a deep understanding of unique and ever-evolving metrics on which technology companies trade. I am very grateful to have been a part of Perspectec.”
Ayesha
Senior Financial Analyst in a volatile growth industry
“My time at Perspectec and Robin's mentorship really helped shape my understanding of the ebbs and flows of the market and the value creation that the buy side values. Robin's focus on discovering the true underlying economic value and his intense drive to gain an edge helped shape my foundations at the beginning of my career, which set me up for the rest of my career.”
Hamza A.
Equity Research Associate at a Multi-National Investment Bank
“Working with Robin and Perspectec has definitely sharpened my research and investment acumen. The group's focus on the dynamic technology space, among others, as well as Robin's guidance and the group's support have all aided me in my development. I would definitely recommend this program to students looking to improve their investment craft. It's extremely rare to have the opportunity to take-on a live research role where your skills are tested and refined and at the same time have your creativity and insight valued.”
Jeremy Y.
Investment Analyst working in Public Equity Investments at a 'Big Five' Canadian bank
“I worked at Perspectec for 6 months and it was an incredible journey. I am forever grateful to Robin, who personally invested in my career growth and learning path. While at Perspectec, I sharpened my financial modelling skills while learning the most creative ways to conduct differentiated research and present it in a format that was marketable to institutional investors. As an international student, it is also difficult to break into the Canadian job market without Canadian experience. Perspectec provided me with the very necessary experience at the right time while finishing my Master's in Finance from Queen's University.”
Mishma B.
Consultant Risk Advisory at a 'Big Four' Accounting firm
“Working at Perspectec provided an invaluable experience into the world of equity research. I was able to develop a deep understanding of how investments are valued while building strong research and financial modeling skills. Robin was a pivotal player during my time at Perspectec where he fostered a positive environment, providing valuable opportunities for one to develop meaningful skills. It was a pleasure having the opportunity to work with Robin.”
Michael W.
Economist at Finance Canada
Alumni Careers
Other Associates have found success soon after as
Investment Banking Associate at a Toronto-based boutique investment bank
Investment Banking VP at a Toronto-based boutique investment bank
Equity Research Associate at a big 5 Canadian bank
Private Equity Associate at a multi-national PE firm
Investment Research Analyst at a large Canadian family office
Research Associate at a Toronto-based investment management firm
Investment Analyst at a Toronto-based venture capitalist
Investment Specialist at a Big 5 Canadian bank
Our program has a proven track record of launching successful careers in institutional finance
Over 50% of Perspectec equity research associates have found full-time employment in buy-side/sell-side equity research, investment banking, investment analysis or private equity within six months of completing their time with Perspectec, which includes successfully launching research coverage with us.
The Perspectec Equity Research Associate AI Program, as the name suggests, now incorporates AI in all aspects of equity research
Program Details:
- •Capped at four individuals
- •Duration: 3 months
- •Fee (CAD): $2,500 + API costs beyond $60.
- •Start Date: October 2025
Ideal Candidate Mix:
Working towards your CFA. Demonstrated interest in the stock market. Ideally in post-grad program. Can reduce program costs by introducing relevant mathematical models to the research and/or aiding Perspectec and the group with marketable work not normally undertaken in equity research.
Working towards your CFA. Demonstrated interest in the stock market. Ideally in post-grad program. Can reduce program costs by introducing further improvements in automation with the initiation process and/or aiding Perspectec and the group with marketable work not normally undertaken in equity research.
Can discuss the mechanics of financial statements and drivers of valuation in person. Working towards your CFA. Demonstrated interest in the stock market. Ideally in post-grad program.
Focus:
Launch coverage by leveraging best in-class A.I., which at the moment primarily involves Claude Code and its sub-agents. Will also leverage Perspectec's software in order to ramp up financial modelling faster and AI agents to generate exhibits. This allows for more time to be spent on due diligence.
- 1.Deep understanding of one stock for one associate
- 2.Leveraging generative A.I. in order to speed up model and report generation
- 3.Collaborating with Robin and peers from contrasting disciplines
- 4.After initiating coverage and publishing, present the report to buyside
Generate differentiated equity research that moves the market. Feel free to reach out if you are interested.
.jpg)